


Analyzing Stock Charts for Beginners: A Comprehensive Guide
Contents
- 1 Stock Charts for Beginners
- 1.1 Analyzing Stock Charts for Beginners: A Comprehensive Guide
- 1.2 Introduction to Stock Charts
- 1.3 Types of Stock Charts
- 1.4 Key Components of Stock Charts
- 1.5 Common Stock Chart Patterns
- 1.6 Technical Indicators for Stock Chart Analysis
- 1.7 How to Start Analyzing Stock Charts
- 1.8 Conclusion
- 1.9 Frequently Asked Questions (FAQs)
- 1.9.1 1. How can I get started with stock chart analysis?
- 1.9.2 2. What are the most important patterns to look for in stock charts?
- 1.9.3 3. How can I use technical indicators to improve my analysis?
- 1.9.4 4. Are stock charts useful for short-term or long-term investing?
- 1.9.5 5. What should I do if I see conflicting signals on a stock chart?
- 2 Stock Charts for Beginners
Stock Charts for Beginners
Analyzing Stock Charts for Beginners: A Comprehensive Guide
Understanding stock charts is crucial for anyone venturing into the stock market. Stock charts provide a visual representation of a stock’s price movements over time, helping investors make informed decisions. In this comprehensive guide, we will delve into the basics of analyzing stock charts, including key concepts, common patterns, and practical examples.

Introduction to Stock Charts
Stock charts are tools that display historical price and volume data of a stock over a specific period. They help investors track past performance and forecast future price movements.
What is a Stock Chart?
A stock chart is a graphical representation of a stock’s price history. It plots the price of a stock over time, typically using time intervals such as minutes, hours, days, weeks, or months. Stock charts can be used to analyze trends, patterns, and market sentiment.
Why Analyze Stock Charts?
Analyzing stock charts helps investors identify potential buying or selling opportunities. By examining price trends and patterns, investors can make predictions about future price movements and improve their investment decisions.

Types of Stock Charts
There are several types of stock charts, each offering a different perspective on price movements.
Line Charts
Line charts are the simplest type of stock chart. They plot the closing prices of a stock over a specific period, connected by a continuous line.
Advantages:
- Easy to read and understand.
- Useful for identifying overall trends.
Disadvantages:
- Lacks detail about intra-day price movements.
- Doesn’t provide information on trading volume.
Example: A line chart of Apple Inc. (AAPL) showing closing prices over the past year.

Bar Charts
Bar charts display price movements within a specific time period using vertical bars. Each bar represents the opening, closing, high, and low prices.
Advantages:
- Provides more detailed information than line charts.
- Shows price fluctuations within the time period.
Disadvantages:
- Can be more complex to interpret.
- May be overwhelming for beginners.
Example: A bar chart of Microsoft Corporation (MSFT) showing daily price movements over the past month.
Candlestick Charts
Candlestick charts offer a more detailed view of price movements than line or bar charts. Each candlestick represents the opening, closing, high, and low prices within a specified time period.
Advantages:
- Provides a detailed view of price movements.
- Helps identify specific patterns and trends.
Disadvantages:
- Can be difficult for beginners to interpret.
- Requires understanding of candlestick patterns.
Example: A candlestick chart of Tesla Inc. (TSLA) displaying hourly price movements.

Key Components of Stock Charts
To effectively analyze stock charts, you need to understand several key components.
Price
The price is the most fundamental component of stock charts. It represents the value at which a stock is traded.
Example: The current price of Alphabet Inc. (GOOGL) on a stock chart.
Volume
Volume refers to the number of shares traded within a given time period. It is often shown as a bar chart below the price chart.
Example: Trading volume for Amazon.com Inc. (AMZN) over the past week.
Trend Lines
Trend lines are straight lines drawn on a chart to connect significant price points. They help identify the direction of the price movement.
Example: An upward trend line connecting the lows of Microsoft Corporation’s (MSFT) price movements.
Support and Resistance Levels
Support levels are price points where a stock tends to stop falling and starts to rise. Resistance levels are where the price tends to stop rising and starts to fall.
Example: Support and resistance levels for NVIDIA Corporation (NVDA) based on recent price history.

Common Stock Chart Patterns
Stock chart patterns can signal potential future price movements. Here are some common patterns to watch for:
Head and Shoulders
The head and shoulders pattern signals a reversal in trend. It consists of three peaks: a higher peak (head) between two lower peaks (shoulders).
Advantages:
- Useful for identifying trend reversals.
- Provides clear signals for buying or selling.
Disadvantages:
- Can be misleading if the pattern is not well-formed.
- Requires confirmation from other indicators.
Example: Head and shoulders pattern on the chart of Netflix Inc. (NFLX).
Double Top and Double Bottom
The double top pattern indicates a bearish reversal, with two peaks at approximately the same price level. The double bottom pattern signals a bullish reversal, with two troughs at roughly the same price level.
Advantages:
- Helps identify potential reversal points.
- Can be used in conjunction with other technical indicators.
Disadvantages:
- Patterns can be false signals.
- Requires confirmation to avoid mistakes.
Example: Double top pattern observed in the stock chart of Johnson & Johnson (JNJ).

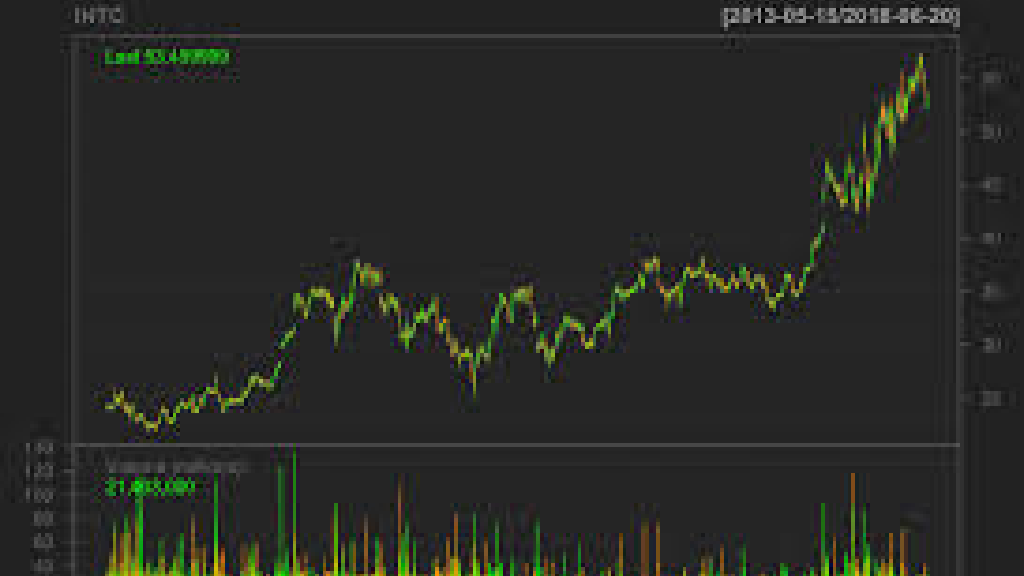
Triangles
Triangles are continuation patterns that indicate the consolidation phase of a stock’s price movement. They can be ascending, descending, or symmetrical.
Advantages:
- Useful for identifying continuation of trends.
- Can help forecast future price movements.
Disadvantages:
- Patterns may take time to develop.
- Requires additional analysis to confirm trends.
Example: Symmetrical triangle pattern in the chart of Intel Corporation (INTC).
Technical Indicators for Stock Chart Analysis
Technical indicators are mathematical calculations based on historical price and volume data. They help in analyzing stock charts and making trading decisions.
Moving Averages
Moving averages smooth out price data to create a trend-following indicator. Common types include the Simple Moving Average (SMA) and the Exponential Moving Average (EMA).
Advantages:
- Helps identify the direction of the trend.
- Reduces the noise from price fluctuations.
Disadvantages:
- Lagging indicator that may not reflect real-time market conditions.
- Can produce false signals in choppy markets.
Example: 50-day SMA and 200-day EMA of Facebook Inc. (META).
Relative Strength Index (RSI)
RSI measures the speed and change of price movements, indicating overbought or oversold conditions. It ranges from 0 to 100, with values above 70 indicating overbought conditions and below 30 indicating oversold conditions.
Advantages:
- Helps identify potential reversal points.
- Useful for confirming trends.
Disadvantages:
- Can be misleading during strong trends.
- Requires additional indicators for confirmation.
Example: RSI of Apple Inc. (AAPL) showing overbought conditions.

Moving Average Convergence Divergence (MACD)
MACD is a momentum indicator that shows the relationship between two moving averages of a stock’s price. It consists of the MACD line, the signal line, and the histogram.
Advantages:
- Useful for identifying changes in trend direction.
- Helps in spotting momentum shifts.
Disadvantages:
- Can be less effective in sideways markets.
- Requires confirmation from other indicators.
Example: MACD crossover in the chart of Microsoft Corporation (MSFT).
How to Start Analyzing Stock Charts
Starting with stock chart analysis can seem daunting, but here are some steps to guide you through the process:
1. Choose a Charting Platform
Select a charting platform that suits your needs. Many online brokerage platforms offer free charting tools, or you can use dedicated charting services like TradingView or ThinkorSwim.
2. Understand the Basics
Familiarize yourself with the basics of chart types, key components, and common patterns. Start with simple line charts before progressing to more complex candlestick charts.
3. Learn Technical Indicators
Explore different technical indicators and learn how to use them effectively. Practice interpreting moving averages, RSI, and MACD to gain insights into market trends.
4. Practice Analyzing Charts
Begin by analyzing historical charts of well-known stocks. Identify trends, patterns, and key levels of support and resistance. Apply your knowledge to make practice trades and assess the outcomes.
5. Keep a Trading Journal
Maintain a trading journal to record your chart analysis, trading decisions, and outcomes. This will help you refine your skills and learn from your experiences.

Conclusion
Analyzing stock charts is a valuable skill for any investor. By understanding the different types of charts, key components, and common patterns, you can make more informed trading decisions. Remember, stock chart analysis is both an art and a science. It requires practice and experience to master. Use this guide as a starting point, and continue to build your knowledge and skills over time.
Frequently Asked Questions (FAQs)
1. How can I get started with stock chart analysis?
Begin by selecting a charting platform and familiarizing yourself with basic chart types and components. Practice analyzing historical charts and learning technical indicators to build your skills.
2. What are the most important patterns to look for in stock charts?
Key patterns include head and shoulders, double top and double bottom, and triangles. These patterns can indicate potential trend reversals or continuations.
3. How can I use technical indicators to improve my analysis?
Technical indicators like moving averages, RSI, and MACD help you identify trends, momentum, and potential reversal points. Use them in conjunction with chart patterns for more accurate analysis.
4. Are stock charts useful for short-term or long-term investing?
Stock charts are useful for both short-term and long-term investing. Short-term traders use charts to make quick decisions, while long-term investors use them to understand overall trends.
5. What should I do if I see conflicting signals on a stock chart?
When encountering conflicting signals, consider using additional indicators or analysis techniques to confirm your findings. Avoid making decisions based solely on one signal or pattern.


Post Comment