


Technical Analysis for Beginners: Understanding Charts and Trends

Contents
- 1 technical analysis for beginners
- 1.1 Technical Analysis for Beginners: Understanding Charts and Trends
- 1.1.1 Introduction
- 1.1.2 Basics of Technical Analysis
- 1.1.3 Types of Charts
- 1.1.4 Understanding Chart Components
- 1.1.5 Key Concepts in Technical Analysis
- 1.1.6 Popular Technical Indicators
- 1.1.7 Pattern Recognition
- 1.1.8 Developing a Trading Strategy
- 1.1.9 Common Mistakes in Technical Analysis
- 1.1.10 Case Studies and Examples
- 1.1.11 The Psychology of Trading
- 1.1.12 Continuous Learning and Improvement
- 1.1.13 Conclusion
- 1.1.14 FAQs
- 1.1.15 technical analysis for beginners
- 1.1.16 ETFs vs. Mutual Funds: Choosing What’s Right for You
- 1.1 Technical Analysis for Beginners: Understanding Charts and Trends
technical analysis for beginners
Technical Analysis for Beginners: Understanding Charts and Trends
Introduction
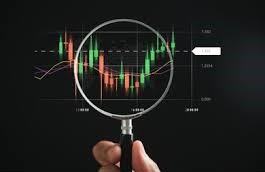
What is Technical Analysis? Well, imagine trying to predict the weather. Just as meteorologists use patterns in weather data to forecast future conditions, traders use technical analysis to forecast stock market movements. It’s a method to evaluate and predict the future price movements of securities by analyzing past market data, primarily price and volume.
The importance of technical analysis in the stock market cannot be overstated. It helps traders identify trading opportunities by analyzing statistical trends gathered from trading activity. Whether you’re a seasoned trader or a newbie, understanding technical analysis can be your gateway to more informed and profitable trading decisions.
Basics of Technical Analysis
So, what exactly is technical analysis? In simple terms, it’s a framework used to evaluate securities by analyzing statistics generated by market activity. Unlike fundamental analysis, which focuses on a company’s financial health and market position, technical analysis is all about patterns and trends.
Technical analysis relies on the assumption that all known information is already reflected in the stock price. Therefore, instead of trying to determine a stock’s intrinsic value, technical analysts focus on price movements and trading volumes.
Types of Charts
Charts are the bread and butter of technical analysis. Let’s break down the three main types:
Line Charts: The simplest form, connecting closing prices over a specified period. It’s great for a quick overview of price movements.
Bar Charts: These show the opening, closing, high, and low prices for a specific period. Each bar represents a period, and the length of the bar indicates the price range.
Candlestick Charts: These provide the same information as bar charts but in a more visually intuitive way. Each candle represents a trading period, with a body showing the opening and closing prices and wicks indicating the high and low prices.
Understanding Chart Components
To make sense of these charts, you need to understand their components:
Timeframes: Charts can represent different timeframes (minutes, hours, days, weeks). The choice depends on your trading strategy.
Price Movements: This is the primary data represented in charts, showing how the price of a security changes over time.
Volume: It indicates the number of shares traded in a given timeframe. High volume can validate a price movement, while low volume might suggest a lack of conviction.

Key Concepts in Technical Analysis
Support and Resistance: Support is a price level where a stock tends to stop falling, and resistance is a level where it tends to stop rising. Identifying these levels helps in making buy or sell decisions.
Trend Lines: These are straight lines drawn on charts to help visualize the general direction of the price movements. An upward trend line indicates increasing prices, while a downward trend line shows decreasing prices.
Moving Averages: These smooth out price data to help identify trends by averaging the prices over a certain period. Commonly used moving averages include the 50-day and 200-day moving averages.
Popular Technical Indicators
Relative Strength Index (RSI): This measures the speed and change of price movements. It ranges from 0 to 100 and is used to identify overbought or oversold conditions.
Moving Average Convergence Divergence (MACD): This shows the relationship between two moving averages of a stock’s price. It helps traders identify potential buy and sell signals.
Bollinger Bands: These consist of a middle band (a moving average) and two outer bands (standard deviations). They help determine whether prices are high or low on a relative basis.

Pattern Recognition
Patterns are at the heart of technical analysis. Here are a few to get you started:
Head and Shoulders: This pattern indicates a potential reversal. It consists of a peak (head) between two smaller peaks (shoulders).
Double Tops and Bottoms: These patterns signal a reversal after two failed attempts to break through a resistance (top) or support (bottom) level.
Triangles and Flags: These continuation patterns indicate that the existing trend is likely to continue after a brief consolidation.
Using Indicators and Patterns Together
Combining indicators and patterns can enhance your analysis. For example:
Combining RSI with Moving Averages: Use RSI to identify overbought/oversold conditions and moving averages to confirm trends.
MACD and Bollinger Bands in Tandem: Use MACD to identify potential buy/sell signals and Bollinger Bands to gauge the volatility and potential price range.
Developing a Trading Strategy
A solid trading strategy is crucial. Here’s how to build one:
Setting Entry and Exit Points: Use support and resistance levels to determine when to enter or exit a trade. For instance, buy when a stock reaches a support level and sell at a resistance level.
Risk Management Techniques: Always use stop-loss orders to limit potential losses. Position sizing, which determines how much capital to allocate to each trade, is also essential.
Common Mistakes in Technical Analysis
Even the best traders make mistakes. Here are some to avoid:
Overreliance on Indicators: Indicators are useful, but they shouldn’t be the sole basis of your trading decisions. Always consider the broader market context.
Ignoring Market News: Technical analysis doesn’t account for external factors like economic news or company announcements, which can impact stock prices.

Case Studies and Examples
Learning from real-life examples can be invaluable. Here are a few:
Successful Trades Using Technical Analysis: For instance, traders who identified a head and shoulders pattern in a stock like XYZ Corp were able to predict a reversal and profit from the subsequent price drop.
Learning from Failed Predictions: Not all predictions come true. Analyzing why a certain pattern failed can provide insights and help refine your strategy.
The Psychology of Trading
Trading is as much about psychology as it is about analysis. Here’s why:
Emotional Discipline: Keeping emotions in check is crucial. Greed and fear can lead to impulsive decisions that often result in losses.
Avoiding FOMO (Fear of Missing Out): Stick to your strategy and avoid the temptation to jump into trades because everyone else is.
Tools and Resources for Technical Analysis
Having the right tools can make all the difference. Here are some recommendations:
Best Software and Platforms: Platforms like TradingView and MetaTrader offer robust charting and analysis tools.
Recommended Books and Courses: Books like “Technical Analysis of the Financial Markets” by John Murphy and online courses from reputable providers can deepen your knowledge.
Continuous Learning and Improvement
The market is always evolving, and so should you. Here’s how:
Keeping Up with Market Trends: Follow financial news and market reports to stay informed about the latest trends and developments.
Joining Trading Communities: Engage with other traders through forums, social media groups, and trading clubs to share insights and learn from others.
Conclusion
In conclusion, technical analysis is a powerful tool for traders of all levels.By understanding charts, recognizing patterns, and using indicators, you can make more informed trading decisions. Remember, continuous learning and emotional discipline are key to success in the stock market. So, start small, keep learning, and happy trading!
FAQs
Q1: What is the best chart type for beginners?
A1: Candlestick charts are often recommended for beginners due to their visual clarity and comprehensive information.
Q2: How can I identify a trend?
A2: Trend lines and moving averages are useful tools for identifying trends in stock prices.
Q3: What is the most reliable technical indicator?
A3: No single indicator is the most reliable. It’s best to use a combination of indicators for more accurate analysis.
Q4: Can technical analysis predict market crashes?
A4: Technical analysis can provide signals that a market is overbought or oversold, but it can’t predict crashes with certainty.
Q5: How often should I review my trading strategy?
A5: Regularly reviewing and adjusting your strategy, at least once a quarter, is essential to adapt to changing market conditions.
technical analysis for beginners
ETFs vs. Mutual Funds: Choosing What’s Right for You


2 comments